
Reports Overview
Esta página aún no está disponible en tu idioma.
This guide explains everything you need to know about generating, customizing, and accessing reports for your jobs from the web app.
Table of Contents
Section titled “Table of Contents”Where to Generate Reports
Section titled “Where to Generate Reports”-
Open your job
-
Click the Reports tab in the top right of your screen
-
Click the Generate Report button
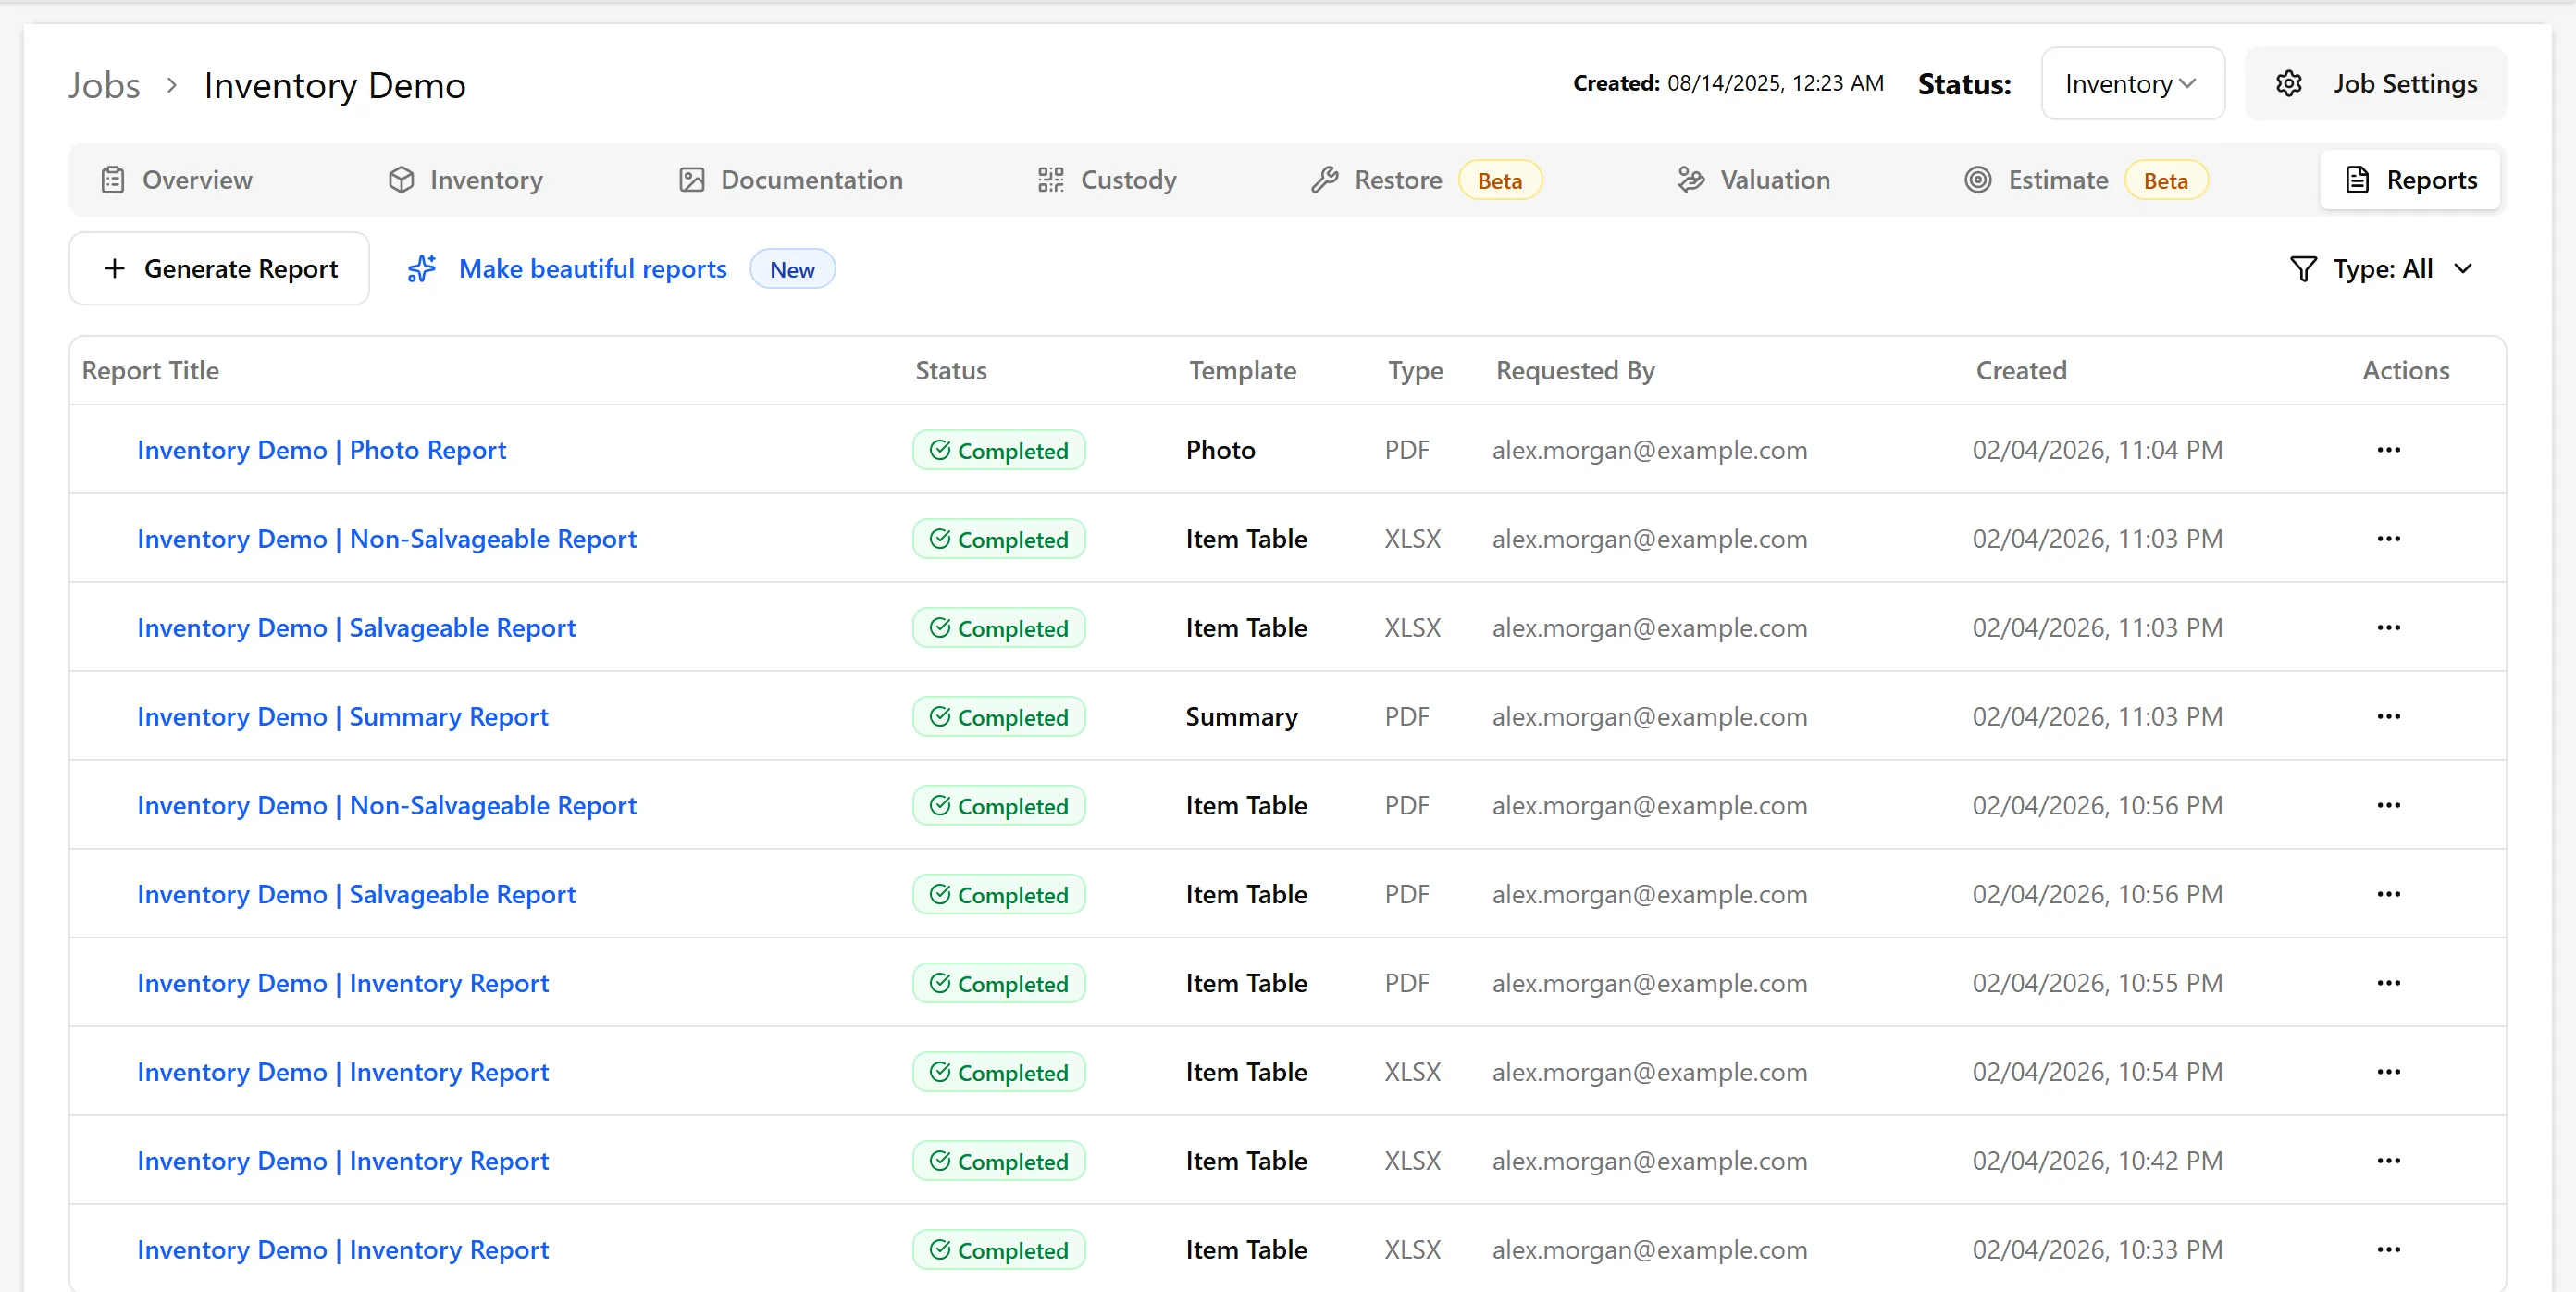
The Reports tab shows you a complete history of all reports for this job, including the report name, who requested it, when it was created, and its status.
You can also start a report straight from the job dashboard: once a job has items (or labels that have been used), a Generate Report quick action appears in the Quick Actions panel and opens the same dialog.
Where Reports Are Stored
Section titled “Where Reports Are Stored”Reports are delivered in two ways:
Immediate Downloads
Section titled “Immediate Downloads”Smaller reports open in a new browser tab (or download) as soon as they’re generated.
Email Delivery
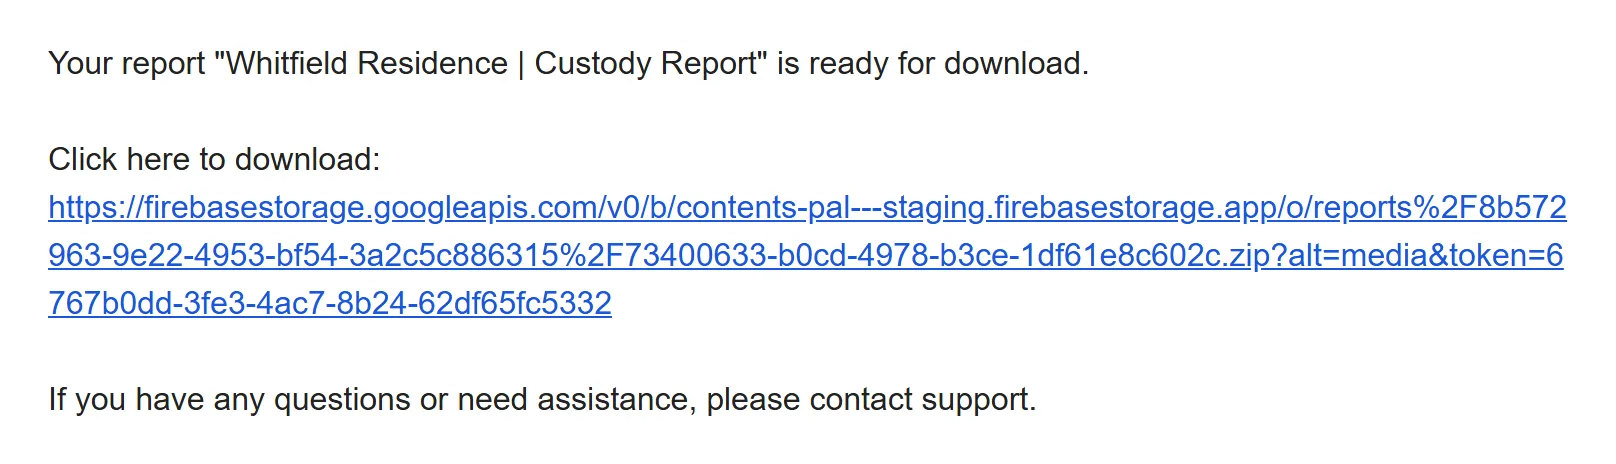
Section titled “Email Delivery”Large reports are generated in the background and sent to your email when ready. This applies to jobs with 2,000 or more items (1,000 or more for photo reports), and to any report you split into a separate file per room:
-
The email includes a link to download the report
-
Check your spam folder if you don’t see the email
When generating a report you can also tick Email this Report to send the finished file to specific addresses. From there you can choose to email it to yourself, and—if the job has a customer email saved in its settings—directly to the customer.
Reports Tab
Section titled “Reports Tab”The Reports tab keeps a complete history of all reports:
-
View all reports ever generated for this job
-
See the status (Pending, Generating, Completed, or Failed)
-
Download reports again anytime
-
See who requested each report and when
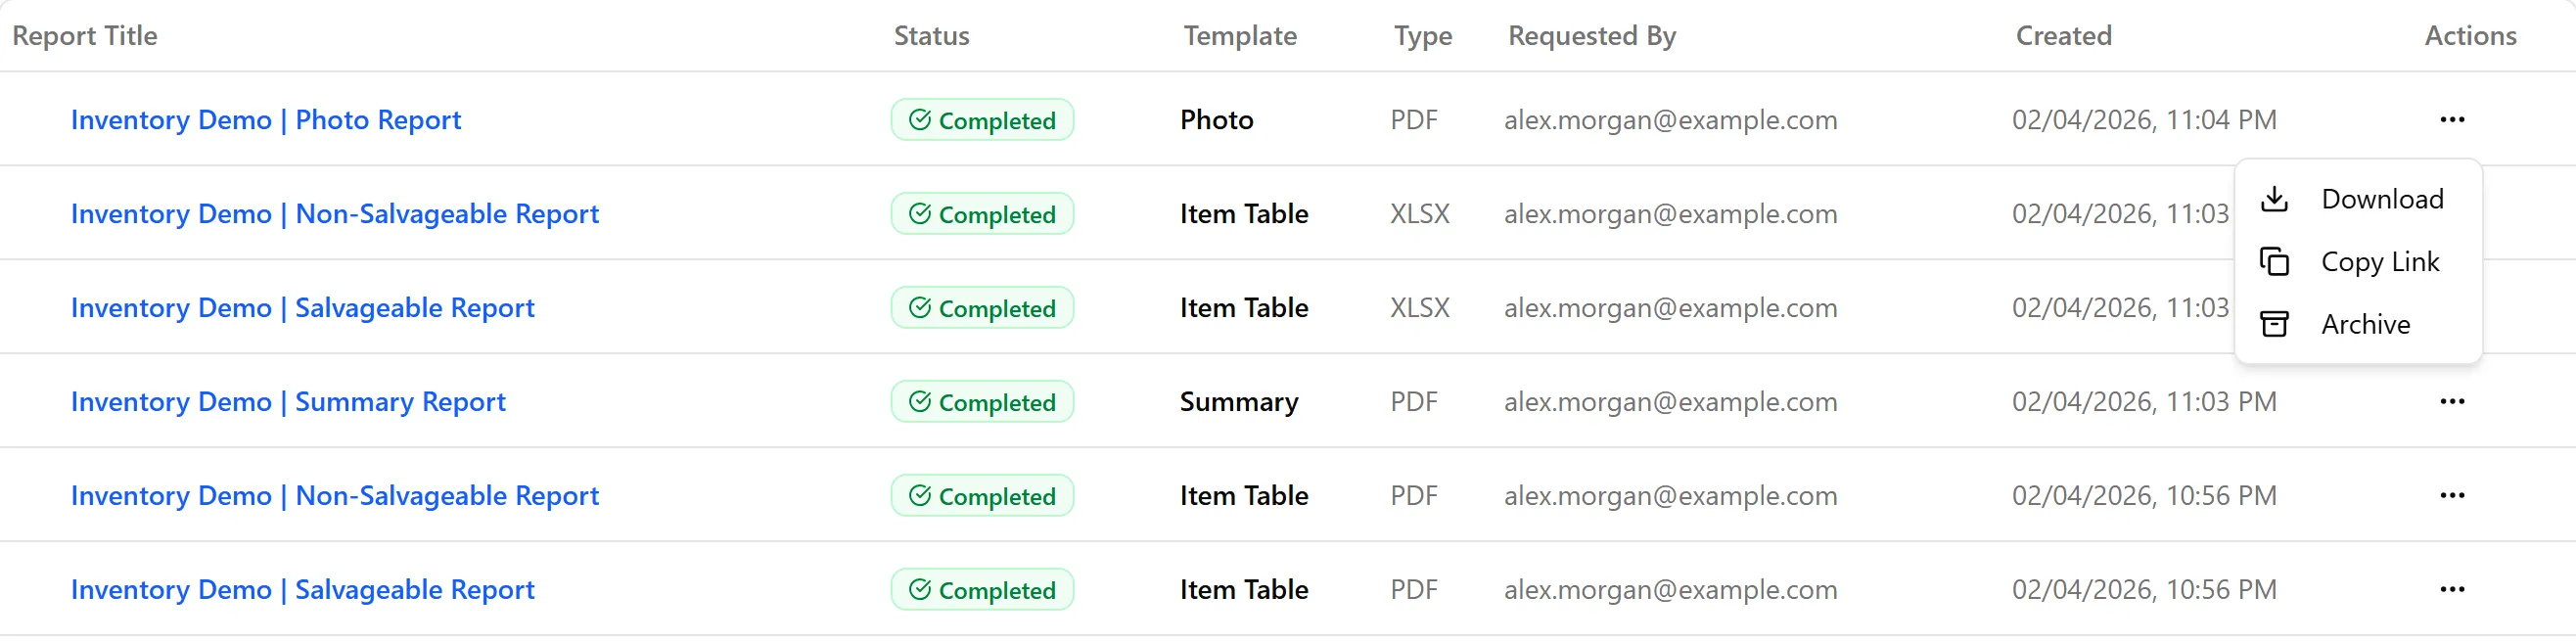
To download a report again:
-
Find the report in the list
-
Click the … menu on the right side of the row and choose Download (you can also choose Copy Link to share it)
-
The file saves to your computer
Reports stay available, so you can re-download them anytime. To change a report’s name, choose Rename from the same … menu. To tidy up the list, choose Archive.
In the mobile app: open the job’s Documents tab and choose Reports to see the same list. Tap a report to Open it, Share file, or Copy link — Copy link opens your phone’s share sheet, so you can copy the link or text it to a customer who doesn’t use email.
Types of Reports
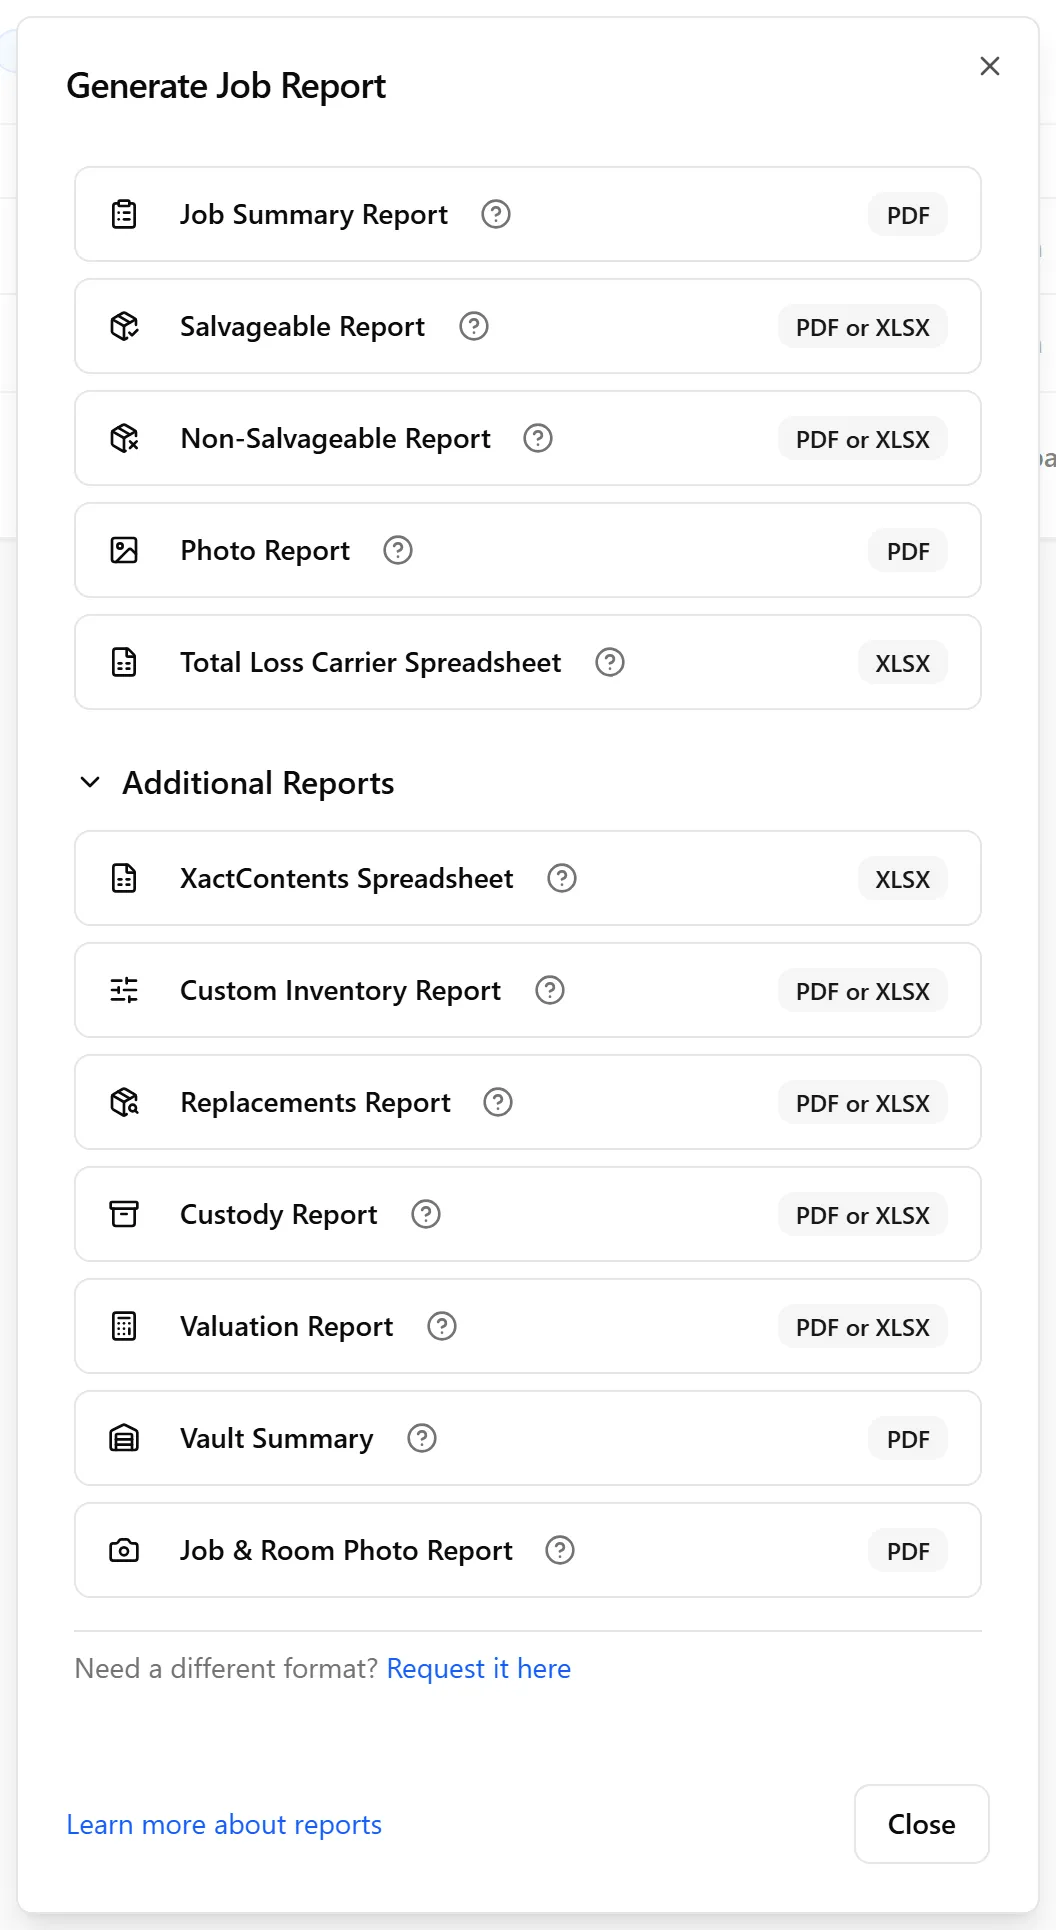
Section titled “Types of Reports”The Generate Report dialog organizes reports into two sections: primary reports (always visible) and additional reports (in a collapsible section). This makes the most commonly used reports easy to access while keeping specialized reports available when needed.
Which report should I use?
-
A list of everything in the job for your customer — salvageable and non-salvageable items together, with each item’s storage and cleaning category: Custom Inventory Report, with its filters left empty
-
Only the items being kept (stored, left on site, or sent to a third party): Salvageable Report
-
Only the items being disposed of: Non-Salvageable Report
-
Photos of the items: Photo Report
-
A file to import into Xactimate or other estimating software: XactContents Spreadsheet
-
A checklist for pulling selected boxes out of storage: Pick List
Primary Reports
Section titled “Primary Reports”Job Summary Report
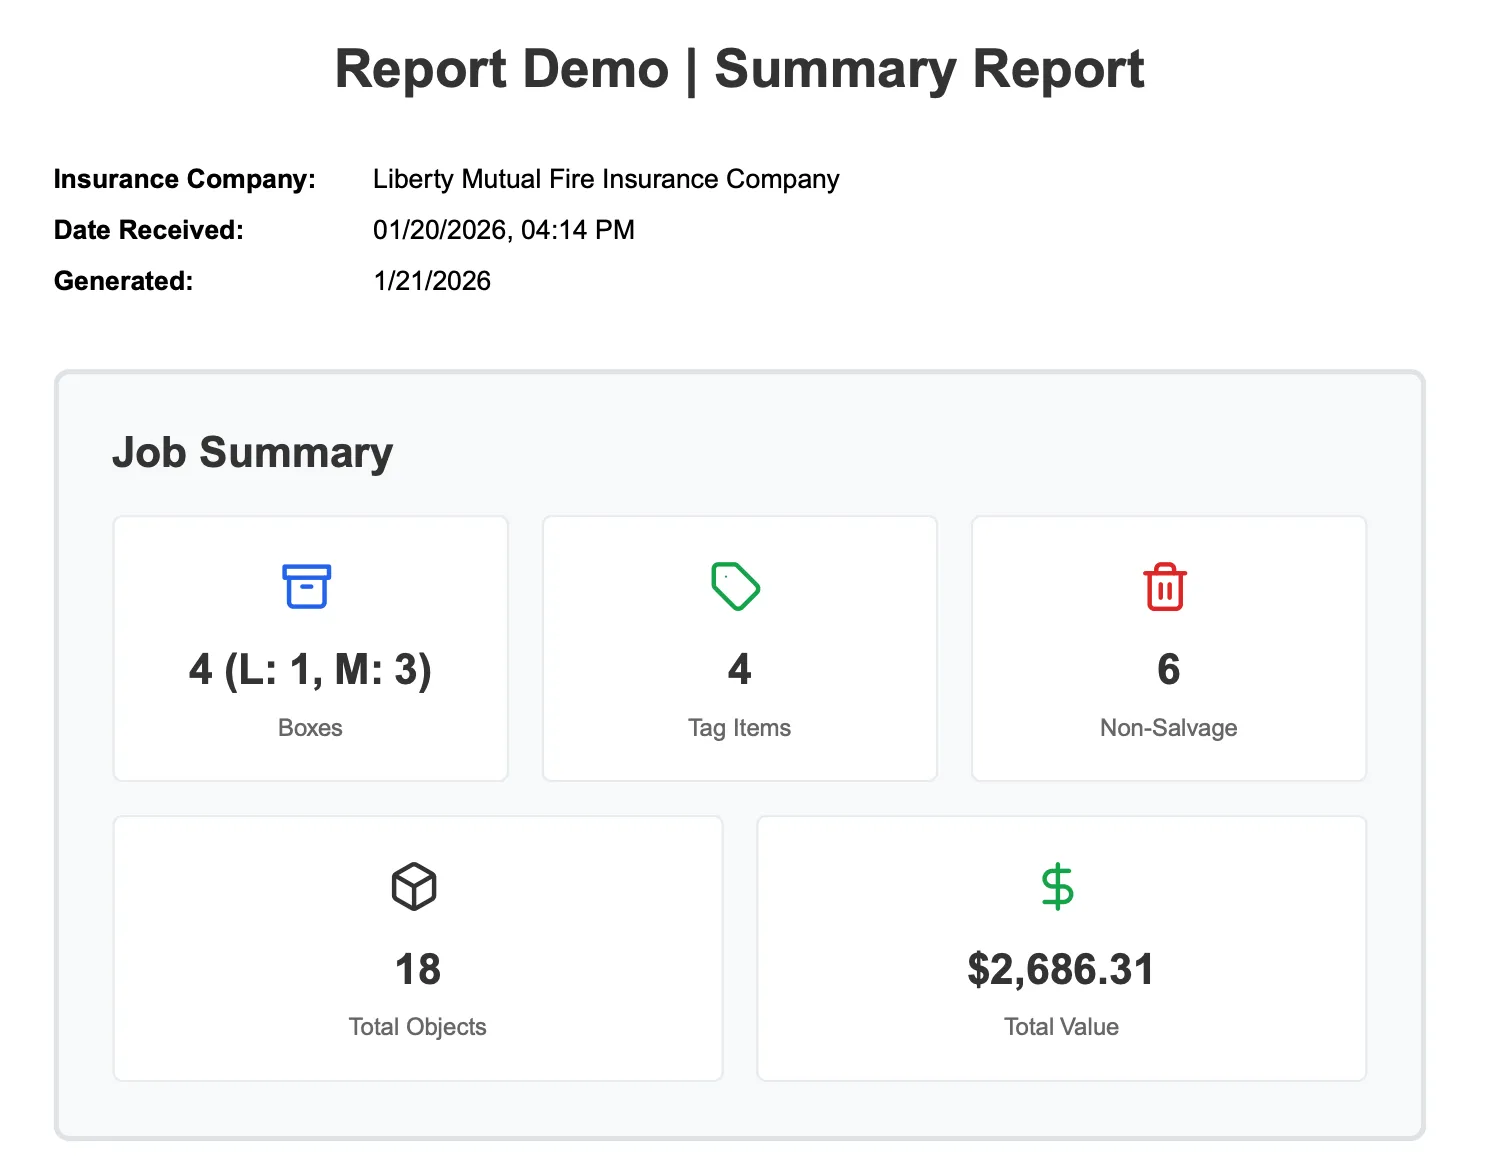
Section titled “Job Summary Report”A high-level overview of your entire job including:
-
Job information and metadata
-
Summary statistics by room
-
Item counts and totals
-
Optional total value
Format: PDF only
Best for: Quick overviews to share with stakeholders or build estimates
Salvageable Report
Section titled “Salvageable Report”Pre-configured to show items being stored, left on site, or sent to third parties. Includes photos, names, descriptions, and quantities, grouped by room and label.
This report focuses specifically on salvageable items and includes advanced options like split by room/label, item filters, and column selection.
Format: PDF or Spreadsheet (XLSX)
Best for: Tracking items in storage or custody
Non-Salvageable Report
Section titled “Non-Salvageable Report”Pre-configured to show items that cannot be salvaged. Includes photos, names, descriptions, quantities, and brands, grouped by room.
This is the opposite of the Salvageable Report - it only shows non-salvageable items. It has all the same advanced options as the Salvageable Report.
Format: PDF or Spreadsheet (XLSX)
Best for: Documenting items for disposal
Photo Report
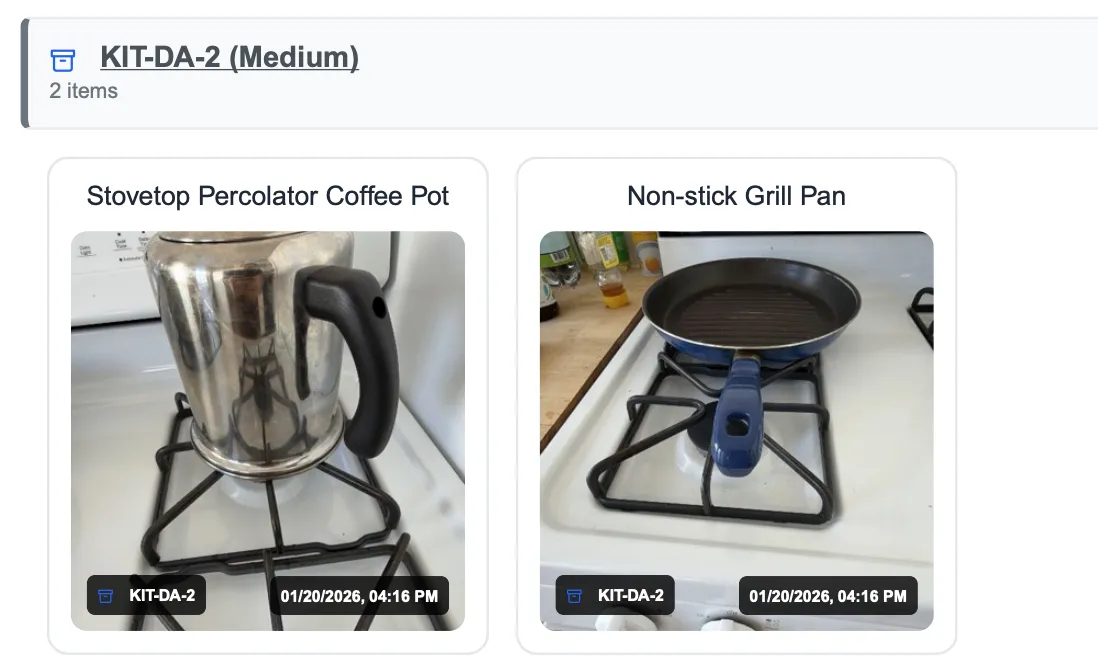
Section titled “Photo Report”Sometimes called a “Presentation Report”, this provides visual documentation of items with photos:
-
Every photo of each item by default, or limit it to 1, 3, or 6 photos per item
-
Optional overlays: title, quantity, cost, timestamp, label, item number (found in Advanced Options)
-
Can split by room or label
-
Toggles to include or exclude job and room photos
Format: PDF only
Best for: Visual presentation of damaged items
Total Loss Carrier Spreadsheet
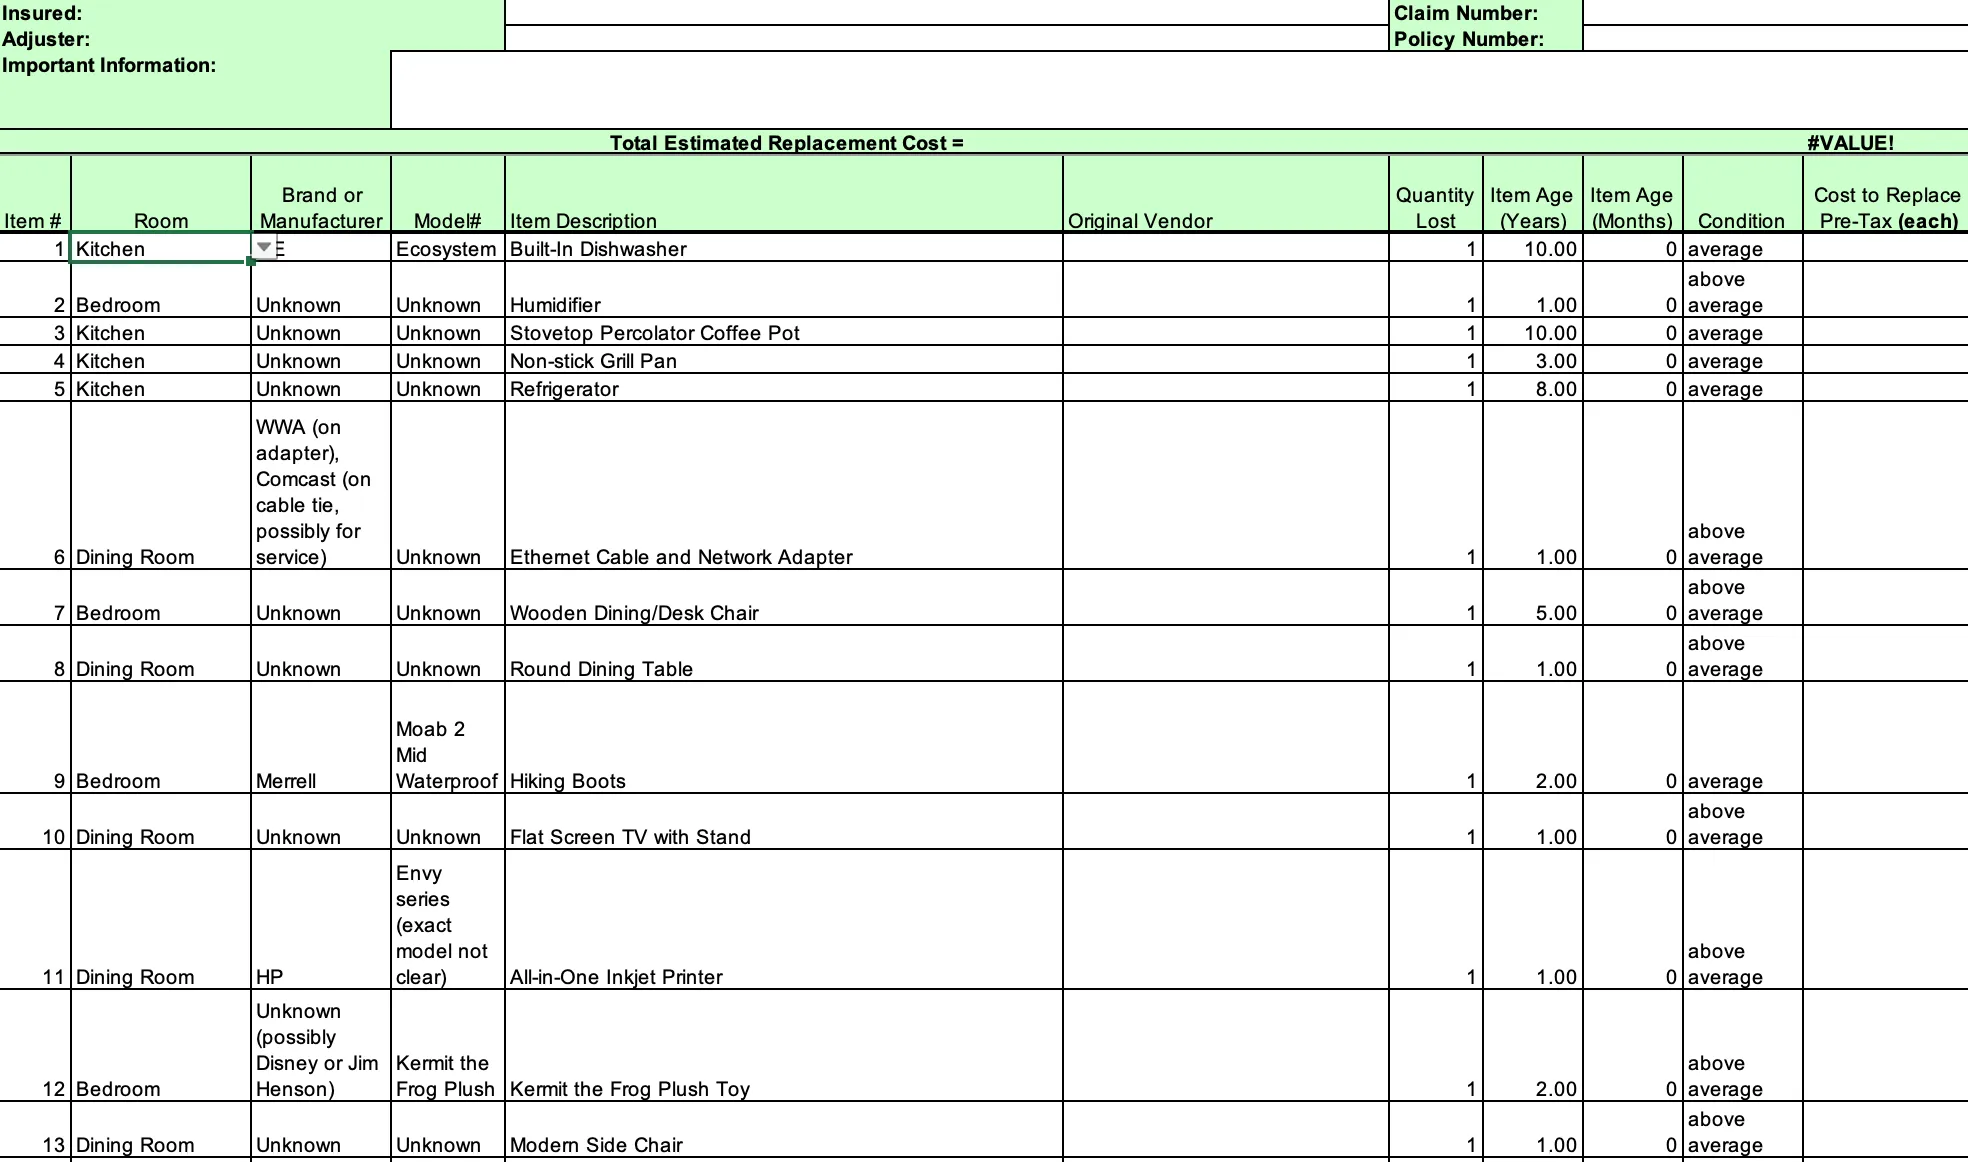
Section titled “Total Loss Carrier Spreadsheet”A non-salvageable inventory spreadsheet in a specific carrier’s layout:
-
Pick the carrier’s layout from the Output Format dropdown; if the job’s insurance company matches a built-in layout, it’s preselected for you
-
Includes any export templates your organization has added
-
Unit price and vendor values are removed by default; untick those options to keep them
Format: Spreadsheet (XLSX) only
Best for: Sending a total-loss inventory in the format a carrier asks for
Additional Reports
Section titled “Additional Reports”These reports are available in a collapsible “Additional Reports” section for more specialized needs.
XactContents Spreadsheet
Section titled “XactContents Spreadsheet”A standardized Excel inventory of non-salvageable items, formatted for import into estimation software:
-
XactContents layout by default, or a carrier-specific template (Allstate, State Farm, USAA, and more)
-
Compatible with third-party estimation and claims software
-
Unit price and vendor values are removed by default; untick those options to keep them
Format: Spreadsheet (XLSX) only
Best for: Exporting to estimation software like Xactimate, or a specific carrier’s claim system
Custom Inventory Report
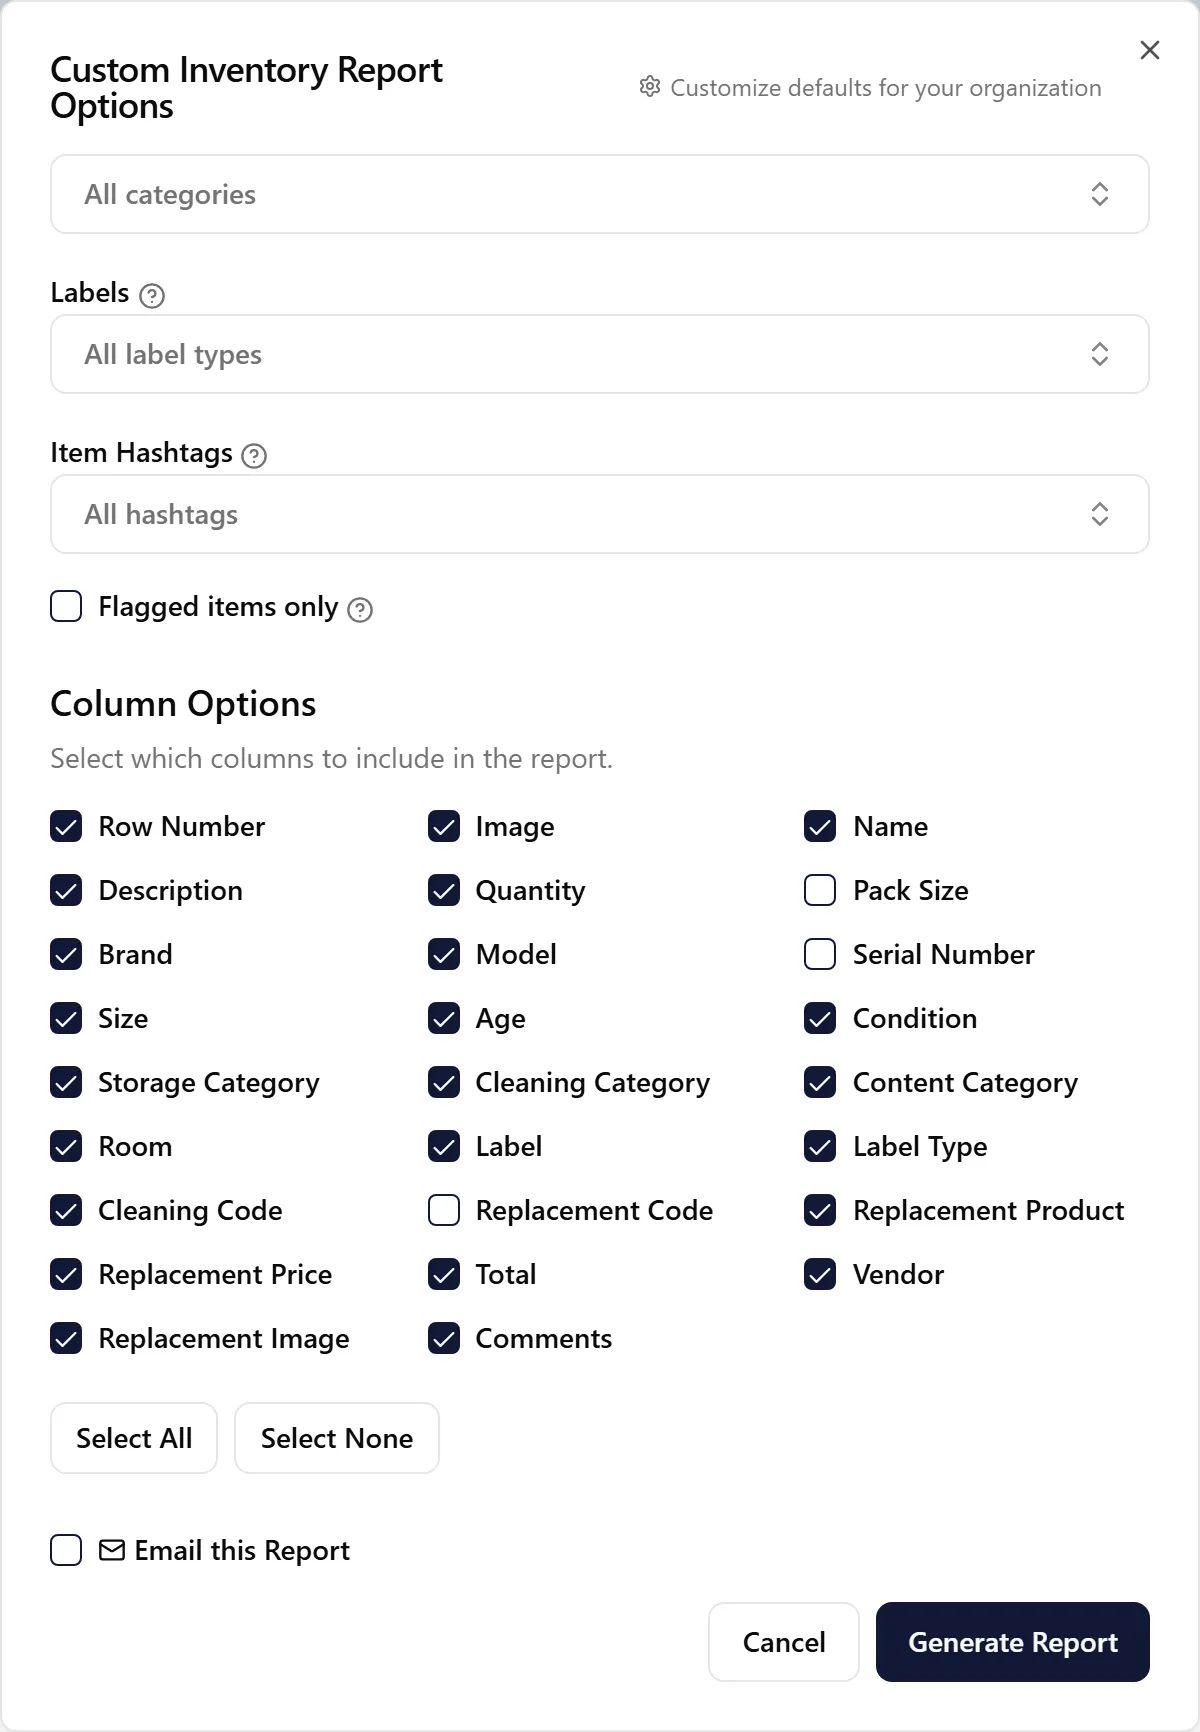
Section titled “Custom Inventory Report”A fully customizable report where you control every detail:
-
Split by room or label for organized sections
-
Choose exactly which columns to include (pricing, age, brand, etc.)
-
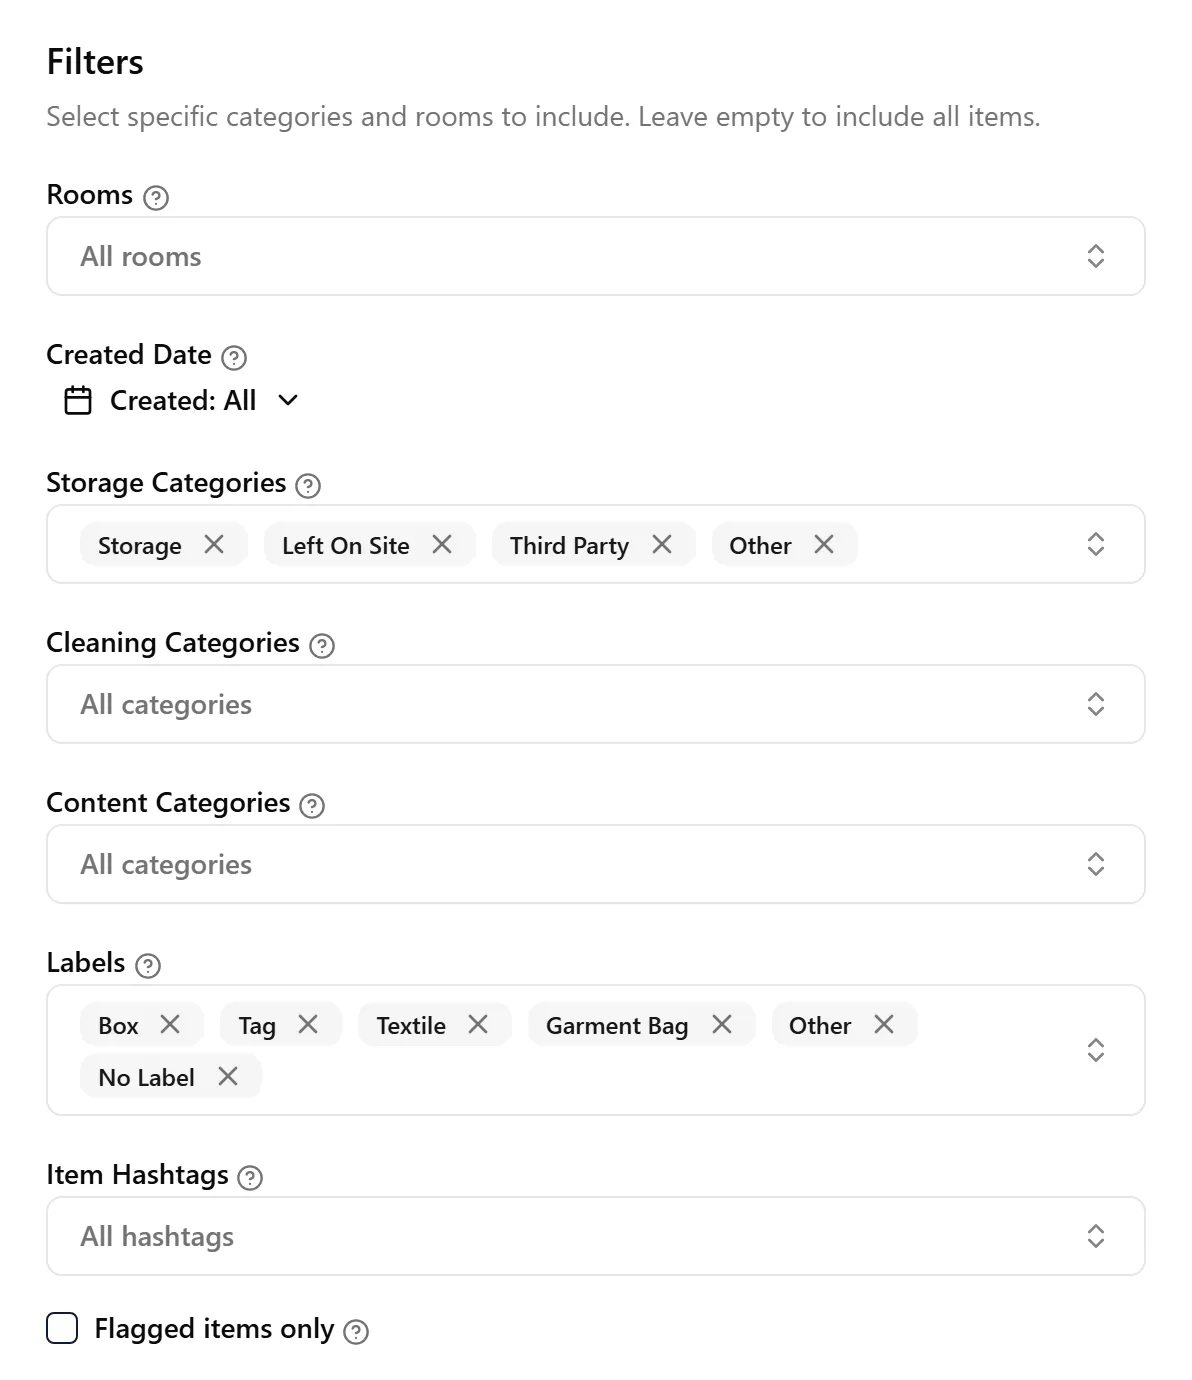
Filter by storage category, cleaning category, content category, room, label type, hashtag, created date, or flagged items
You can customize which columns appear in your report. For example, when sending reports to external parties, you may want to exclude pricing and age information.
Format: PDF or Spreadsheet (XLSX)
Best for: Creating tailored reports for specific stakeholders, building reports with unique column combinations, or when the preset reports don’t match your exact needs
Replacements Report
Section titled “Replacements Report”Pre-configured to show replacement pricing information for non-salvageable items:
-
Displays the replacement product and replacement price
-
Shows replacement images alongside the item photos
-
Includes brand, model, and age
Format: PDF or Spreadsheet (XLSX)
Best for: Insurance claims and valuation
Custody Report
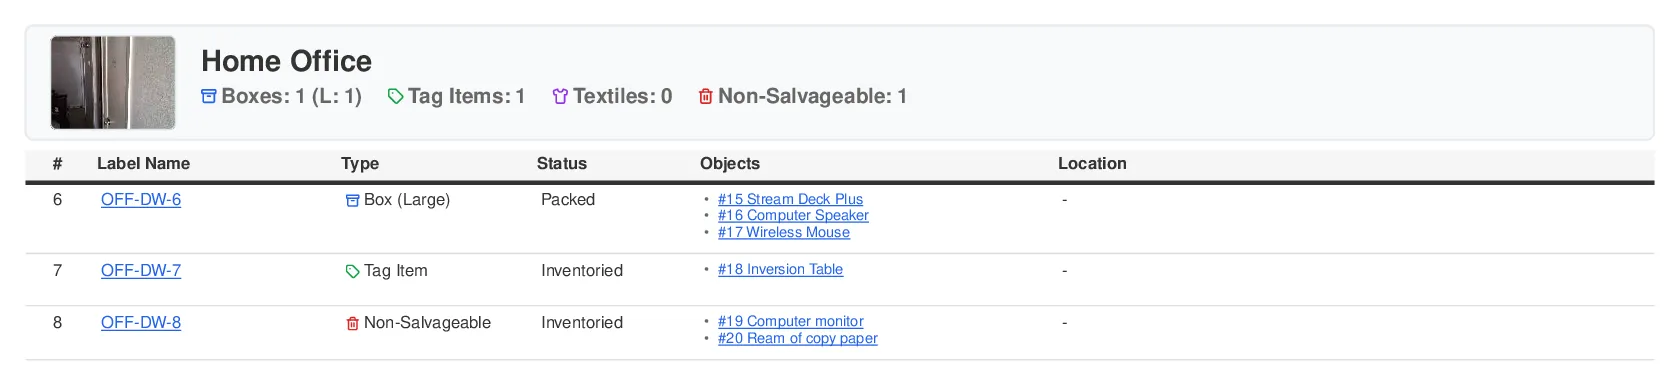
Section titled “Custody Report”Track boxes, bags, textiles, and labeled items:
-
Shows label name, type (box, tag, textile, etc.), status, and location
-
Lists items inside each container
-
Optional cost to replace column
-
Filter by box, tag, textile, garment bag, non-salvageable, or other label types
Format: PDF or Spreadsheet (XLSX)
Best for: Chain of custody documentation and tracking packed items
Materials Usage Report
Section titled “Materials Usage Report”Totals the packing materials used on the job, one row per material:
-
Boxes by size, furniture blankets/pads, plastic covers, stretch wrap, and bubble wrap
-
Each box label counts as one box of its size, plus any consumables added to labels in the mobile app
-
Job totals first, then each room on its own page
-
Optional Xactimate code column (on by default)
Format: PDF or Spreadsheet (XLSX)
Best for: Billing or reporting the packing supplies used on a packout
Performance Report
Section titled “Performance Report”Shows each team member’s work on the job. Only organization admins can generate it or see it in the job’s report list.
-
A team table with each member’s items, boxes, tags, non-salvage items, estimated hours, days, work sessions, and items per hour
-
Charts of items and hours by member, and estimated hours per day
-
A page per member with their daily hours and each work session (on by default)
-
Items count each item once, whatever its quantity
-
Hours are estimated from the times of recorded activity (items, labels, rooms, and photos), not clocked time
Format: PDF or Spreadsheet (XLSX)
Best for: Reviewing how the team worked a job
Valuation Report
Section titled “Valuation Report”Non-salvageable items with their valuation figures:
-
Reported and sourced prices, vendor, and total replacement cost (RCV)
-
Age, depreciation category, rate, and amount, and actual cash value (ACV)
-
Optional tax and RCV + tax columns
Format: PDF or Spreadsheet (XLSX)
Best for: Presenting replacement values and depreciation for a claim
Availability: Plans that include AI pricing. On the Starter and Standard plans the button shows a lock.
Job & Room Photo Report
Section titled “Job & Room Photo Report”Focuses on documentation photos rather than item photos:
-
Shows photos taken of rooms and the job site
-
Organized by room
-
Includes timestamps
-
No item photos
Format: PDF only
Best for: Documenting property damage and conditions
Vault Summary
Section titled “Vault Summary”Printable labels for each storage vault used by the job:
-
Cover page per vault with a large scannable QR code, job details, and inventory summary cards (boxes, tag items, textiles)
-
Contents list of every label in the vault, each with its own QR code
-
Designed to be printed and attached to the physical vault so staff can scan to locate contents
Format: PDF only
Best for: Labeling warehouse vaults and locating belongings by scanning
Pick List
Section titled “Pick List”A printable checklist for pulling a customer’s contents out of storage, when they want items back from several vaults:
-
One row per box or tag, sorted in the order you walk the warehouse: by site, then aisle, bay and level, then location name. Labels that aren’t in a location are listed last as Not stored
-
Each row shows the label’s location in large type, with its aisle, bay and level and its site, plus the items in the label and a Picked box to tick on paper
-
Optional columns: row number, type, items, room, status, comments, and a QR Code for each label so the technician can scan it while picking
-
No cover page, and a Picked by and Date line at the top
To list only certain labels, open the job’s Custody tab, check the labels the customer wants, then click Print and choose Pick List. Started from the Reports tab (or with no labels checked), it lists every label that matches the label type and room filters.
Format: PDF only
Best for: Pulling selected contents from several vaults for a pack back or delivery
Reports vs Data Exports
Section titled “Reports vs Data Exports”It’s important to understand the difference:
Reports
Section titled “Reports”-
Purpose: Professional documents ready to share
-
Format: Formatted PDFs or organized spreadsheets
-
Includes: Headers, footers, your organization logo, page numbers, summaries
-
Use for: Sending to clients, insurance companies, or stakeholders
Data Exports
Section titled “Data Exports”-
Purpose: Retrieve raw data from your tables
-
Format: Plain CSV or spreadsheet files
-
Includes: Just the data, no formatting
-
Use for: Importing into other systems, data analysis, or custom manipulation
Where to find Data Exports:
-
Click on any table in your job (Inventory, Custody, etc.)
-
Look for the Export button
-
These give you the raw table data that you can manipulate as you wish
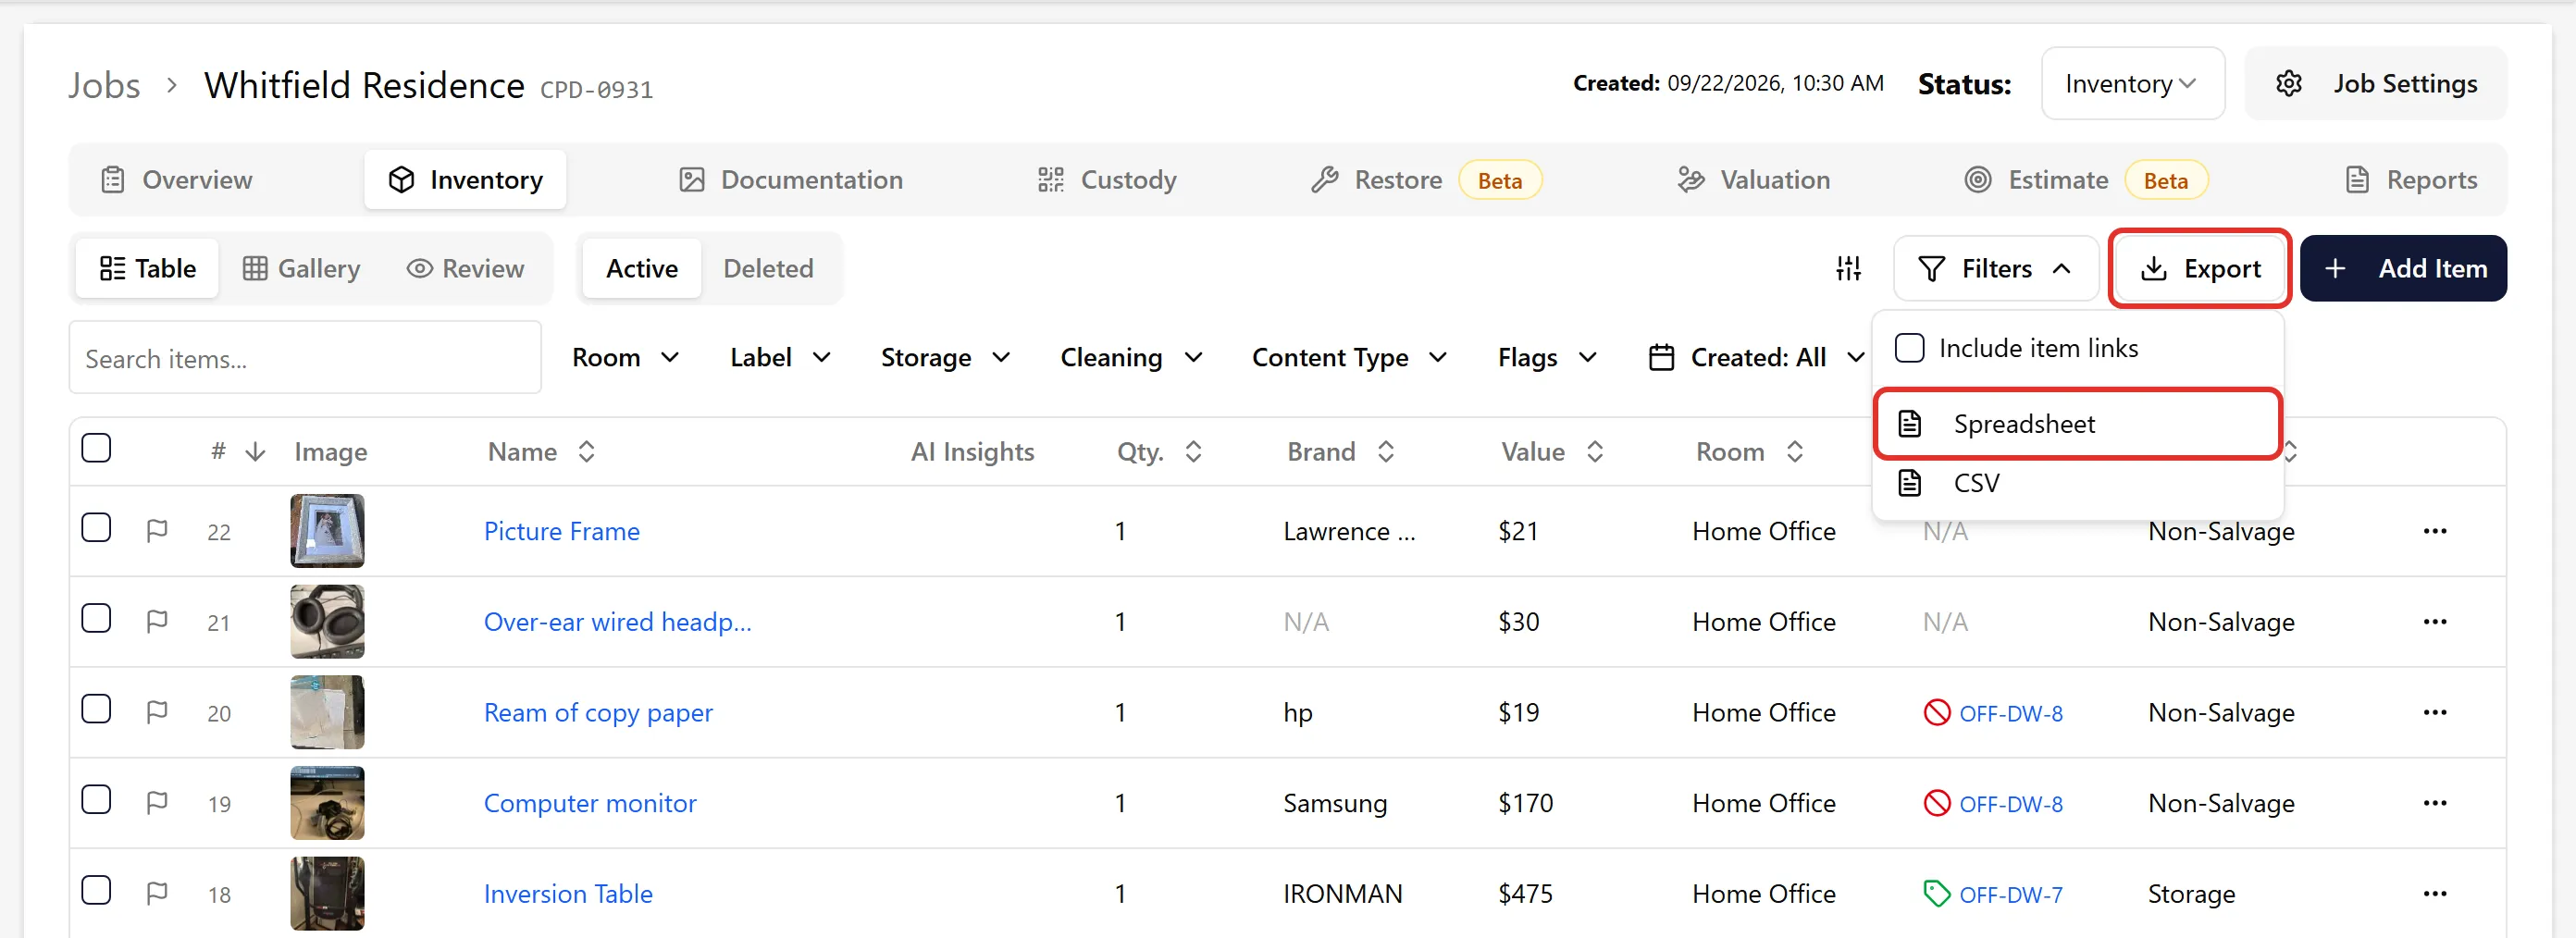
The Inventory tab’s Export menu has two options:
-
Selected items only — appears once you check items in the table, and is ticked by default. Untick it to export every item matching your current search and filters.
-
Include item links — turns each item’s name into a link to that item’s page.
Then choose Spreadsheet or CSV.
Printing Only Selected Items
Section titled “Printing Only Selected Items”Reports cover the whole job (narrowed by their filters), not the items you’ve checked in the table. To print just a handful of items:
-
As a spreadsheet: check the items in the Inventory tab, click Export, keep Selected items only ticked, choose Spreadsheet, then open the file and print it.
-
As a PDF with photos: tag the items with a hashtag, then filter a report by it:
-
Check the items in the Inventory tab, open Edit rows → Batch Edit, and under Hashtags choose Add hashtags and pick a hashtag.
-
In the Reports tab, click Generate Report, expand Additional Reports and choose Custom Inventory Report with PDF.
-
Under Item Filters, pick that hashtag in Item Hashtags, then click Generate Report.
Owners and admins can add a dedicated hashtag for this (for example “print”). See Creating Custom Hashtags and the Custom Inventory Report’s Item Filters.
-
PDF vs Spreadsheet Reports
Section titled “PDF vs Spreadsheet Reports”Many report types let you choose between PDF or Spreadsheet format.
PDF Reports
Section titled “PDF Reports”Advantages:
-
Professional appearance with your logo
-
Opens with a cover page showing job photos, claim details and a loss-location map — see Report Cover Page to choose what it shows
-
Fixed formatting that looks the same everywhere
-
Includes images and photos
-
Ready to share or print
-
Better for presentations
Best for:
-
Sending to clients
-
Presentations
-
When visual appearance matters
-
Reports with photos
Spreadsheet (XLSX) Reports
Section titled “Spreadsheet (XLSX) Reports”Advantages:
-
Can sort and filter the data
-
Can add your own calculations
-
Can edit values if needed
-
Can import into other software
-
Smaller file sizes
Best for:
-
Further data analysis
-
Making your own calculations
-
Importing into other tools
-
When you need to modify the data
Note: Photo reports are always PDF because they focus on images. Summary reports are also PDF-only because they include formatted layouts and charts.
Filtering and Customizing Reports
Section titled “Filtering and Customizing Reports”Most reports let you customize what’s included:
Filter by Storage Category
Section titled “Filter by Storage Category”Choose which types of items to include:
-
Storage (items in your facility)
-
Left on site
-
Third party storage
-
Non-salvage
-
Other categories
Filter by Cleaning Category
Section titled “Filter by Cleaning Category”Choose items by their cleaning needs:
-
As Is
-
Needs Cleaning
-
Biohazard
-
Unknown
Filter by Content Category
Section titled “Filter by Content Category”Choose items by their content type:
-
Electronics
-
Antiques
-
Kitchenware
-
Apparel
-
Other content categories
Filter by Room
Section titled “Filter by Room”Select specific rooms to include:
-
Choose one or more rooms
-
Or include all rooms
Filter by Label Type
Section titled “Filter by Label Type”Choose which label types to include (item reports also offer No Label for items that aren’t labeled):
-
Boxes
-
Tags (individual items)
-
Textiles and garment bags
-
Non-salvageable labels
-
Other label types
Split by Room
Section titled “Split by Room”Organize the report with separate sections for each room:
-
Keeps information organized by location
-
Makes large jobs easier to navigate
Split by Label
Section titled “Split by Label”For items with labels, create separate sections for each box or bag:
-
Useful for custody tracking
-
Shows exactly what’s in each container
Troubleshooting
Section titled “Troubleshooting”Report failed
Section titled “Report failed”If a report shows “Failed”:
-
Try generating it again with fewer items (use filters)
-
Try splitting by room to create smaller reports
-
Contact support if the problem continues
Can’t find my report
Section titled “Can’t find my report”-
Check the Reports tab in your job
-
Check your email and spam folder
-
Reports are sorted by creation date (newest first)
Report is missing items
Section titled “Report is missing items”-
Check your filters - you may have filtered out some items
-
Leave a filter empty to include all categories (an empty filter shows “All categories”)
Need Help?
Section titled “Need Help?”If you need a specific report format not listed here, or have questions about reports:
-
Click “Request it here” at the bottom of the Additional Reports section in the Generate Job Report dialog
-
Contact our support team
-
We can create custom report formats for specific needs